Physical processes are the basis for the identification of setback lines. They can cover extreme events and chronic processes, including sea level rise. Physical processes affect each type of coastline, depending on their topography and elevation.
1. Dominant erosion processes
For beach-dune complexes our knowledge of the effect of storms is rather well developed. For instance large-scale experiments have been done in a flume facility. These experiments provided benchmarks for models that can predict erosion levels during extreme events. Sensitivity studies show that the two most important factors are the storm surge level (above mean sea level) and the bed material diameter. Dune erosion increases with increasing storm surge level and with decreasing bed material diameter. The wave period also has a marked influence. Dune erosion increases with increasing wave period.
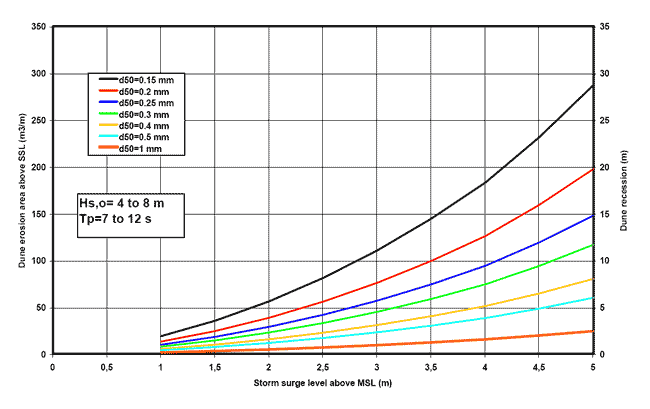
The graph below depicts the dune erosion area (above the storm surge level) after 5 hours as a function of sediment size and storm surge level based on the cross-shore model of Van Rijn [17]. What the figure shows is that dune erosion is very much dependent on the diameter of the sediment. Dune erosion rates are largest for relatively fine sediments and reduce rapidly for coarser sediments. Dune erosion of gravel (1 mm) is only 15% of that of fine sand (0.15 mm). What the figure also shows is that for a fine sandy dune 10 m high a severe storm will produce an erosion rate in the order of 30 m. With this kind of model output, risk lines can be developed such as those shown in the figure below. For example, a North Sea storm with a surge level of 5 m above mean sea level has a return period of about 10,000 years (so on average once in 10,000 years). The return period of a surge level of only 2 m is 1 year; so, on average once every year. The computed dune erosion values are of the order of 20 m3/m for a surge level of 1 m and up to 300 m3/m for a large surge level of 5 m. To withstand an extreme event with surge level of 5 m above mean sea level, the dune row fronting the sea should have a minimum width in the order of 50 m.

Dune erosion after 5 hours of a storm event as a function of sediment size (d50) and storm surge level;
dune recession based on dune height of 10 m above SSL
We can also estimate whether or not the beach/dune complex will recover from chronic erosion. In ‘normal’ conditions with two or three events per year and surge levels between 1 and 2 m per year, the total annual dune erosion may be as large as 50 m3/m/year along sandy North Sea coasts. Most of the eroded dune sand will be deposited on the beach from where it can be returned to the dune front by wind-induced forces or carried away by cross-shore and longshore currents. Dune accretion at the dune front due to wind effects is in the order of 10 to 20 m3/m/year and is generally not sufficient to compensate dune erosion on the annual time scale. Thus, dune erosion generally leads to a permanent loss of sand which can only be compensated by artificial nourishment or dune reinforcement of the order of 50 m3/m/year.
Beach erosion during minor storm events with surge levels below 1 m is of the order of 10 to 20 m3/m per event. Beach build-up during daily fair-weather waves is in the order of 1 to 2 m3/m/day. Thus, beach erosion can easily be compensated for by natural processes on a time scale of weeks.
|