|
In the last few years there has been a rapid change in the technology developed for monitoring the coastal zone, with the emergence of remote sensing, in particular, radically altering the type and volume of data available for addressing coastal management problems. Many of these tools have been developed by scientists to answer questions about detailed coastal processes. Translating the measurements and models of detailed processes (often on small space and time scales) into tools for coastal erosion risk management is not easy or straightforward. The Frame of Reference can assist us what kind of information we need and when. This can be used to design routine monitoring strategies, which currently are lacking in many parts of the European coast.
1. The use of coastal state indicators (CSIs)
By using the Frame of Reference it becomes possible to identify when data is key to informing coastal erosion management decisions. First of all data on the contemporary coastal condition is required for benchmarking: i.e. comparing the current state of the coast with a preferred situation. Secondly, data is needed for the evaluation of measures: do the measures bring the state of the coast closer to the desired state? For these comparisons it is necessary to define Coastal State Indicators (CSIs). CSIs can be described as a reduced set of parameters that can simply, adequately and quantitatively describe the dynamic-state and evolutionary trends of a coastal system. In other words, CSIs relay a complex message in a simple and useful manner [15]. These indicators should adequately describe the quantitative state concepts, as mentioned in the Frame of Reference, allowing a comparison with threshold conditions in the benchmarking step.
CONSCIENCE has developed the use of Coastal State Indicators in coastal erosion management and tested their application at a number of pilot sites. The table below shows the CSIs used in the different pilot sites of the project. It should be noted that these are not the only suitable CSIs that could be used or developed for coastal erosion.
Coastal State Indicators can be measured in different ways. Methods vary between simple low cost monitoring systems, such as using the traditional theodolite, to advanced technologies, using airborne radar and laser equipment. For instance, in the Pevensey case, the information for the CSIs is obtained by mounting a GPS system on a quad bike and driving along breaks in the profile. On the next pages the use of different monitoring systems is discussed.
Grouped Coastal State Indicators found at the pilot sites
CSI |
Quantity
represented |
Pilot
Site |
Dune strength |
Standard of protection
(SoP) for storm |
Dutch
coast |
Barrier width |
Standard of protection
for storm |
Pevensey
|
Total barrier volume |
Standard of protection
for storm |
Pevensey |
Backshore width |
Standard of protection
for storm |
Black
Sea |
Dune zone width |
Standard of protection
for storm |
Black
Sea |
Dune zone height |
Standard of protection
for storm |
Black
Sea |
Momentary coastline |
Position & boundary
condition for SoP |
Dutch
coast |
Beach width |
Boundary condition for
SoP of hard defence |
Costa
Brava |
Barrier crest position |
Position |
Pevensey |
Shoreline position |
Position |
Black
Sea |
Shoreline position |
Position |
Hel
Peninsula |
Coastline position |
Perception of safety
|
Inch
Beach |
Coastal foundation |
Growth with sea level
rise |
Dutch
coast |
Shoreface volume |
Flood and coastal erosion
risk |
Hel
Peninsula |
Coastal slope |
Flood and coastal erosion
risk |
Black
Sea |
2. Monitoring in the coastal zone
Monitoring of beaches provides important information about the state of the coastal system. Data from monitoring provides the input for the statistical descriptors and numerical models of beach behaviour.
There has been an increase in the use of centralised data-stores with standardised procedures and formats for the storage of coastal monitoring data at a regional scale. Examples of this include the development of the Channel Coast Observatory in the UK and the Jarkus database in the Netherlands. Moreover there has been an increase in the development of large-scale numerical models of systems of defences for flood risk management (such as Risk Assessment for Strategic Planning in the UK and VNK in the Netherlands). However, the coastal erosion element in flood and coastal erosion risk management has been neglected up to now.
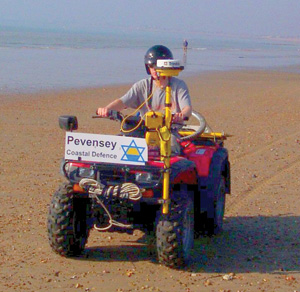
A quad bike with GPS system on Pevensey Beach |
Monitoring guidance
The key points for monitoring guidance include:
- Establish what the data is to be used for. A wide range of data could be used in coastal management, including data on wind, waves, tides, beach sediment, offshore bathymetry, coastal profiles, geomorphological features, coastal defences, beach nourishment or recycling. All will cost money to collect and that cost should be justified;
- Establish a reliable system of ground control points or permanent markers that can be used by all surveying groups, whatever technique they are using;
- Explicitly state the datum system to be used;
- Establish a clear set of guidelines for the surveys, including tolerances and national or international standards to be met (such as ISO or British Standards) and guidance on when to survey (with respect to the months, the spring-neap tidal cycle and the occurrence of storms).
|
|
In light of the above, CONSCIENCE has produced an inventory of innovative monitoring methods and has updated the overview of models developed in EUROSION. The table below gives a list of the methods which have been described and illustrates the variety of methods available. Some of these methods are quite cheap, others require expensive equipment or are costly to operate, such as airborne methods. Each method has its advantages and disadvantages. It is therefore essential to establish what the data will be used for (see box for guidance, on preceding page). A survey programme may, therefore, be based on a conceptual (or numerical) model of coastal hazards or risks. For example, exposed sites with a high risk or flooding or coastal erosion may be surveyed at a closer intervals and more often than a hard rock coastline with a strategy of no active intervention.
One of the most important data needs is for the beach level at the toe of coastal defence structures. In order to be able to identify the beach levels with reasonable confidence, a high resolution is required. Conventional LIDAR (Light Detection and Ranging – it uses light to measure distances) can now provide elevations within ±0.15m, which is good enough for this purpose, but if the data is at 2m intervals, the LIDAR system may miss a seawall. High-resolution LIDAR can provide greater accuracy and reduced distance between surveyed points, so combined with a ground-survey it would achieve the required resolution. All remote sensing systems need a good network of control points to be most effective.
Coastal Monitoring Methods
Monitoring type |
Explanation |
Examples |
Small scale |
Linear arrays of point sensors |
Measurement of the depth of scour under all conditions |
Tell Tail scour monitoring system |
Underwater acoustic measurements of the seabed |
An acoustic backscatter device can be used to detect the level of the seabed and give information about sediment in suspension in situations where the seabed and instrument are fully submerged. |
Autonomous Sand Ripple Profiler (ASRP) |
Measurements of emerged toe levels |
There are a number of techniques that can be used to measure emerged coastal defence structure toe levels at a point every low tide. |
Argus video system
Counting the number of steps above the beach level at access points |
Measurements of mixing depth |
The seabed mixing depth is the maximum depth below the seabed where sediment motion occurs |
Stack of numbered aluminium disks of known height |
Medium scale |
Cross-shore profile surveys and topographic surveys |
Beach profiles and topographic surveys are typically collected using a large range of methods |
Theodolite
Kinematic GPS (e.g. mounted on a quad bike)
Laser scanning systems
Repeated digital photography (Argus)
X-band radar |
Large-scale |
|
|
Mapping of tidelines or shorelines |
The position of the shoreline or tidelines (i.e. location of some representation of high water level and low water level) is commonly marked on maps. Different editions of the same map series, sometimes stretching back more than 100 years, can be used to determine long term changes to the position of the shoreline. |
Orthorectified aerial or satellite photos
Topographic LIDAR
Bathymetric LIDAR
Synthetic Aperture Radar (SAR)
Bathymetric surveys from ships |
|